Capstone // Fan Cost Index
The Fan Cost Index (FCI) is compiled by Team Marketing Report and tracks the price of what they consider an outing for a family to a baseball game, which they do yearly for every venue. This consists of:
- Four average-priced, non-premium tickets
- Four hot dogs
- Two soft drinks, smallest size
- Two beers, smallest size
- Two of the lowest cost available adult-sized caps
- Two copies of the team’s program (tracked up to 2014; not included individually in this report, but included in pre-2015 FCI totals)
- Cheapest parking option for one car
Findings
While we sometimes see some correlation between prices and attendance, it is not always the negative correlation we expect (i.e., attendance increases as venue prices decrease). For example, let’s take a look at the Arizona Diamondbacks, who for the entirety of the 2010-2023 time period had the lowest FCI:
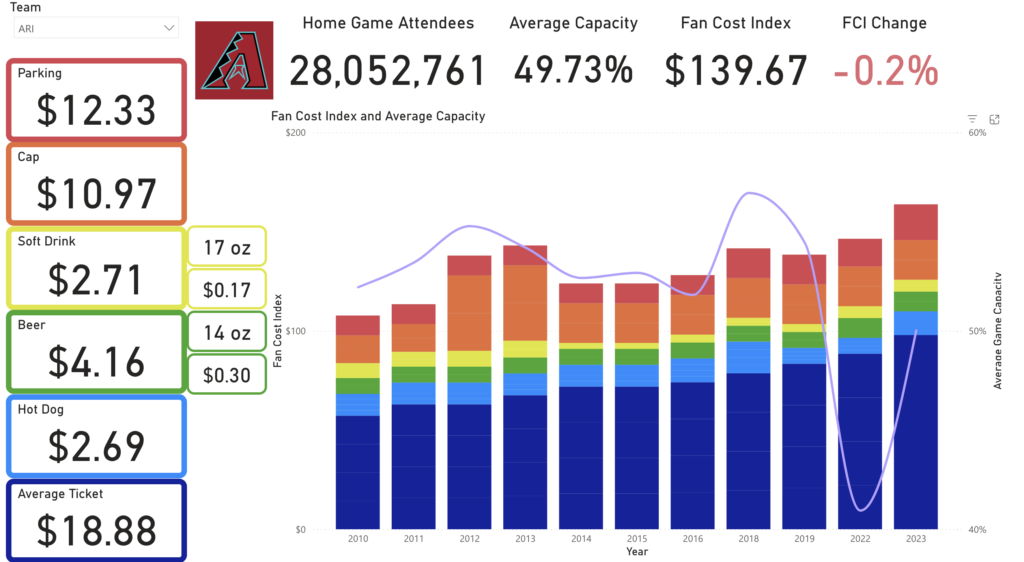
Despite being the cheapest team to attend a game for, their home games were at an average of less than 50% capacity, peaking in 2018 with an average 56.95% capacity for that season.
Now let’s take a look at one of the teams with the more consistently expensive FCI, the Boston Red Sox:

Going to a Red Sox home game costs almost triple what it costs going to a Diamondbacks game, yet the Red Sox boast an enviable >100%* average capacity for the 2010, 2011, and 2012 seasons, and an overall average capacity of 89.2% for this time period.
We see similar patterns with other consistently cheap teams compared to consistently expensive teams. For example, the Tampa Bay Rays had an average FCI of $163.89 and average home game seating of 43.55% of capacity, while the New York Yankees had an average FCI of $330.72 and average home game seating of 80.59% of capacity. More concrete figures relating to correlation between the FCI and attendance can be found at the end of the report, but a cursory glance at these numbers would lead one to believe strong demand for tickets drives prices up.
Notes
- Due to how attendance is counted, venues may have attendance at over 100% capacity. More information on this is in the Introduction pages.
- Since drink sizes vary per venue, the FCI also tracks the drinks’ volume in ounces and calculates the price per ounce. This can be seen on the Power BI dashboard next to each drink: the top amount refers to ounces in the drink, and the bottom amount is the cost per ounce.
- Team Marketing Report was reportedly going through ownership changes in 2017, so no FCI was calculated for that year. However, they report percentage change in cost from year to year, and the percentages reported for 2018 don’t seem to correspond to the 2016 total figures. This leads me to believe that they may have the numbers internally, and it might be possible to calculate an estimated 2017 total FCI, without the individual components.
- The FCI change percentage is based on what is reported by Team Marketing Report, but it does not always correspond to the figures as stated. For example, the Arizona Diamondbacks’ FCI went from $151.55 in 2013 to $126.89 in 2014– a decrease of ~16.3%– but the 2014 FCI document reported this as an increase of 3.6%. Team Marketing Report states that they sometimes make retroactive changes.
- FCIs for the 2020 season (which was based on figures reported by the venues) and the 2021 season are available but were not included in this report due to the limited attendance during those two seasons.
- The 2024 FCI should be available around April 2025, and this report will be updated when it is released.